The Common Platforms team at the Chick-fil-A Support Center focuses on maintaining and improving the systems and services that the other teams in the IT department rely on. A large part of their responsibilities includes keeping an eye on all of the servers and applications that they are in charge of and troubleshooting any errors that come up. As expected, this is a critical role that impacts the rest of the department, but it can be a time consuming task as well, taking away valuable time from other projects that the team would like to focus on.
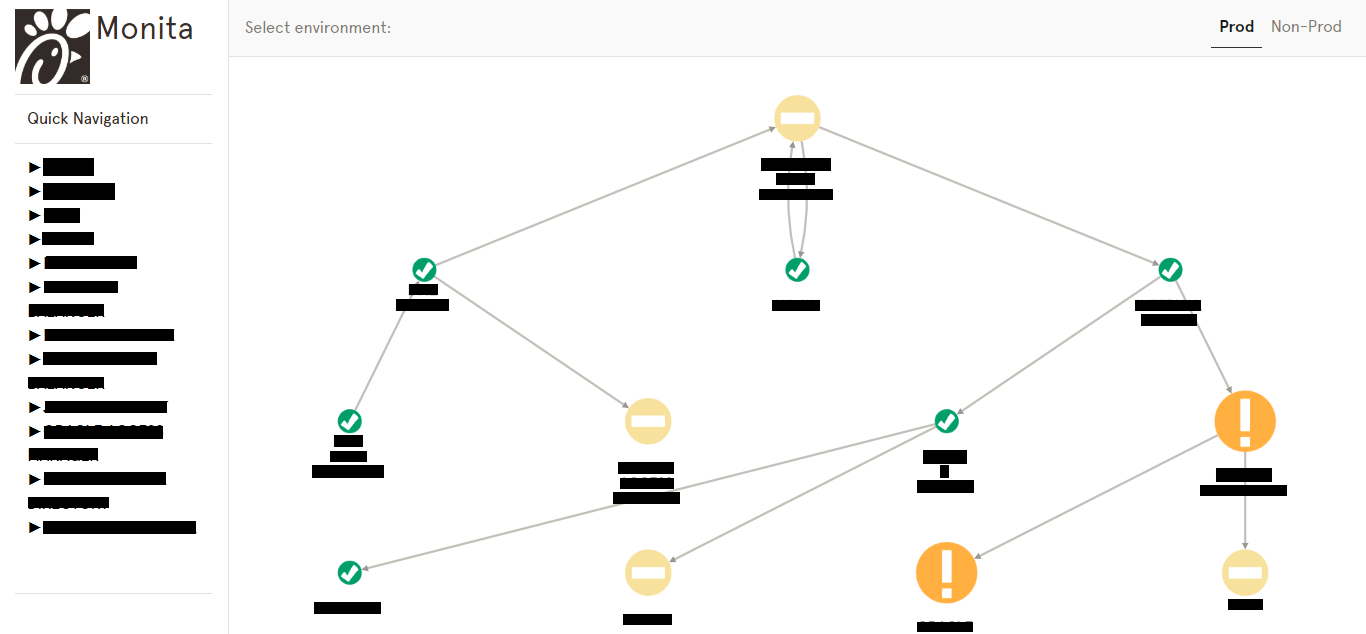
As an intern on their team for the summer, I was tasked with developing an internal web application—Monita—that consolidates the status information of the many servers and applications my team monitors in a way that is easy to understand at a glance. Further, the devices are connected and displayed in a graph to visualize the dependencies and make it simple to trace any errors back to the source.
The server-side was developed using the Flask micro web framework, while client-side was handled using jQuery and Bootstrap. This application is hosted on Amazon Web Services’s Elastic Beanstalk and utilizes Okta’s two-factor authentication to prevent unauthorized access.
Monita’s main feature is a graph of servers and applications. Each node on the graph depicts some system, and its icon represents the system’s status, color-coded for severity. The edges represent direct interactions between systems, such as between an application and its database. Nodes on the graph can also be interacted with to re-arrange the layout.
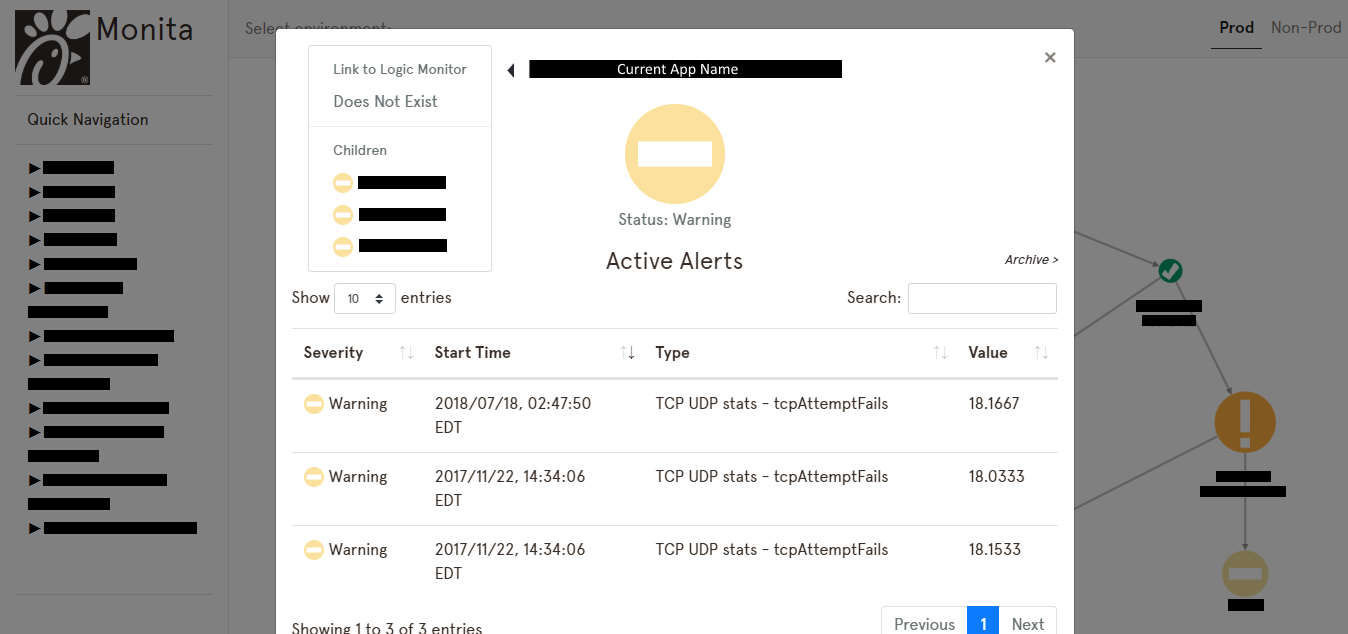
Once an individual node on the graph is selected, it brings up a modal window that displays more detailed information about that node. All active alerts are listed, and a list of all historical alerts can be retrieved as well.
Some nodes are made up of several sub-elements, and that family tree can be navigated here also, allowing the user to identify the specific source of an alert.